Location and Size of the District
The Birim South district is one of the 33 MMDAS in the Eastern Region established under LI 2369 when Achiase District was carved out of it in 2019.
Figure 1.1: Birim South District in National and Regional Context

Source: BSDA DPCU, 2022
Created in 2008, Akim Swedru is the Administrative capita of the Birim South District. The rural district is predominantly Akan (Akyem) and Christian, with key towns including Akim Swedru, Akim Awisa, and Akim Aduasa. There are 78 communities with cottages/hamlets scattered across the district. The District covers an estimated land area of 231.5km2. It shares boundaries with Birim Central in the northeast, Akyemansa to the North, Achiase to the South and Central Region to the West.
Figure 1.1 illustrates the map of the Birim South District Assembly within the national and regional context.
Relief and Drainage
The district is mostly undulating and hilly and lies within the semi-deciduous forest zone. The underlying rock formation is mainly made up of the upper Birimian rocks. These rocks consist predominantly of volcanic lava, schist, hyalites and greywacke with; minor granite intrusions and normally give rise to salty clay soil without course materials. The topography of Birim South District is hilly, consisting of lava flows and schist which in some cases rise to 61 meters above sea level. Hyalite (silica) and greywacke (hardened sandstone) areas have low relief and experience relatively low rainfall.
The district is drained by the Birim River. Its major tributaries include Funso, Apetesu, Asikasu, Ahonfra, Akwassua, Nsuta, Adim, Tropea and Kasawere. Even though the greater part of the Birim River system in the district is permanent, it is not being put to much use. It can be harnessed to serve as a source of pipe-borne water supply to serve most of the communities nearby and for agricultural purposes, especially in the dry season.
Climate
The District falls within the wet semi-equatorial climatic zone which experiences a substantial amount of precipitation/rainfall. Annually rainfall is between 150cm and 200cm reaching its maximum during the two peak periods of May to June and September-October. This promotes intensive farming activities within these two periods i.e. May to June and September to October. The relative humidity is about 56 per cent in the dry season and seventy (70) per cent in the rainy season. The temperature ranges from 25.2˚C and 27.5˚C. The undulating nature of the topography occasionally results in flooding in some communities during the peak period of the rainy season. There is a need for the District to build the capacity of the National Disaster Management Organization to enhance disaster response to the disaster.
Vegetation
The vegetation is mostly characterized by tall trees with evergreen undergrowth endowed with economic trees. The District falls within the semi-deciduous rainforest region leading to a high degree of rainfall for crop cultivation and human use. Human activities such as bad farming practices, lumbering (especially chain saw and firewood operations), illegal mining and construction work have had negative impacts on the vegetation over the years resulting in scattered parcels of secondary forest.
Population Distribution and Demography
The current population of the district is 35,654 as extracted from the 2021 Population and Housing Census. Sex disaggregation of the population in the district follows both the national and regional trends where females outnumber males. Females represent 51.1 per cent of the population against 48.9 per cent of males. In the age group, children under the age of 15 make up 34 per cent of the population of the District. (Population dependency ratio, rural-urban differences) 15 to 64 years account for 59.5 per cent whereas 65 years and above constitute 6.3 per cent of the aged.
Table 1.1: Population size by locality of residence by district and sex
District/ Sex |
All Localities |
Urban |
Rural |
|||
Number |
Per cent |
Number |
Per cent |
Number |
Per cent |
|
Total |
35,654 |
100 |
15,436 |
100 |
20,218 |
100 |
Male |
17,420 |
48.9 |
7,368 |
47.7 |
10,052 |
49.7 |
Female |
18,234 |
51.1 |
8,068 |
52.3 |
10,166 |
50.3 |
Source: 2021 population and Housing Census
Population Density
The district has a population density of 156 persons per square kilometre in 2022, which indicates that the district has registered an increase in population density over the years rising from 165 persons per square kilometre in 2010. The table below shows the projected population density for the next four years.
Table 1.2: Population Density of the District
Years |
2010 |
2022 |
Population |
119,767 |
36,011 |
Pop Density |
165 |
156 |
Source: DPCU, 2022
Figure 1.2: Population of Birim South
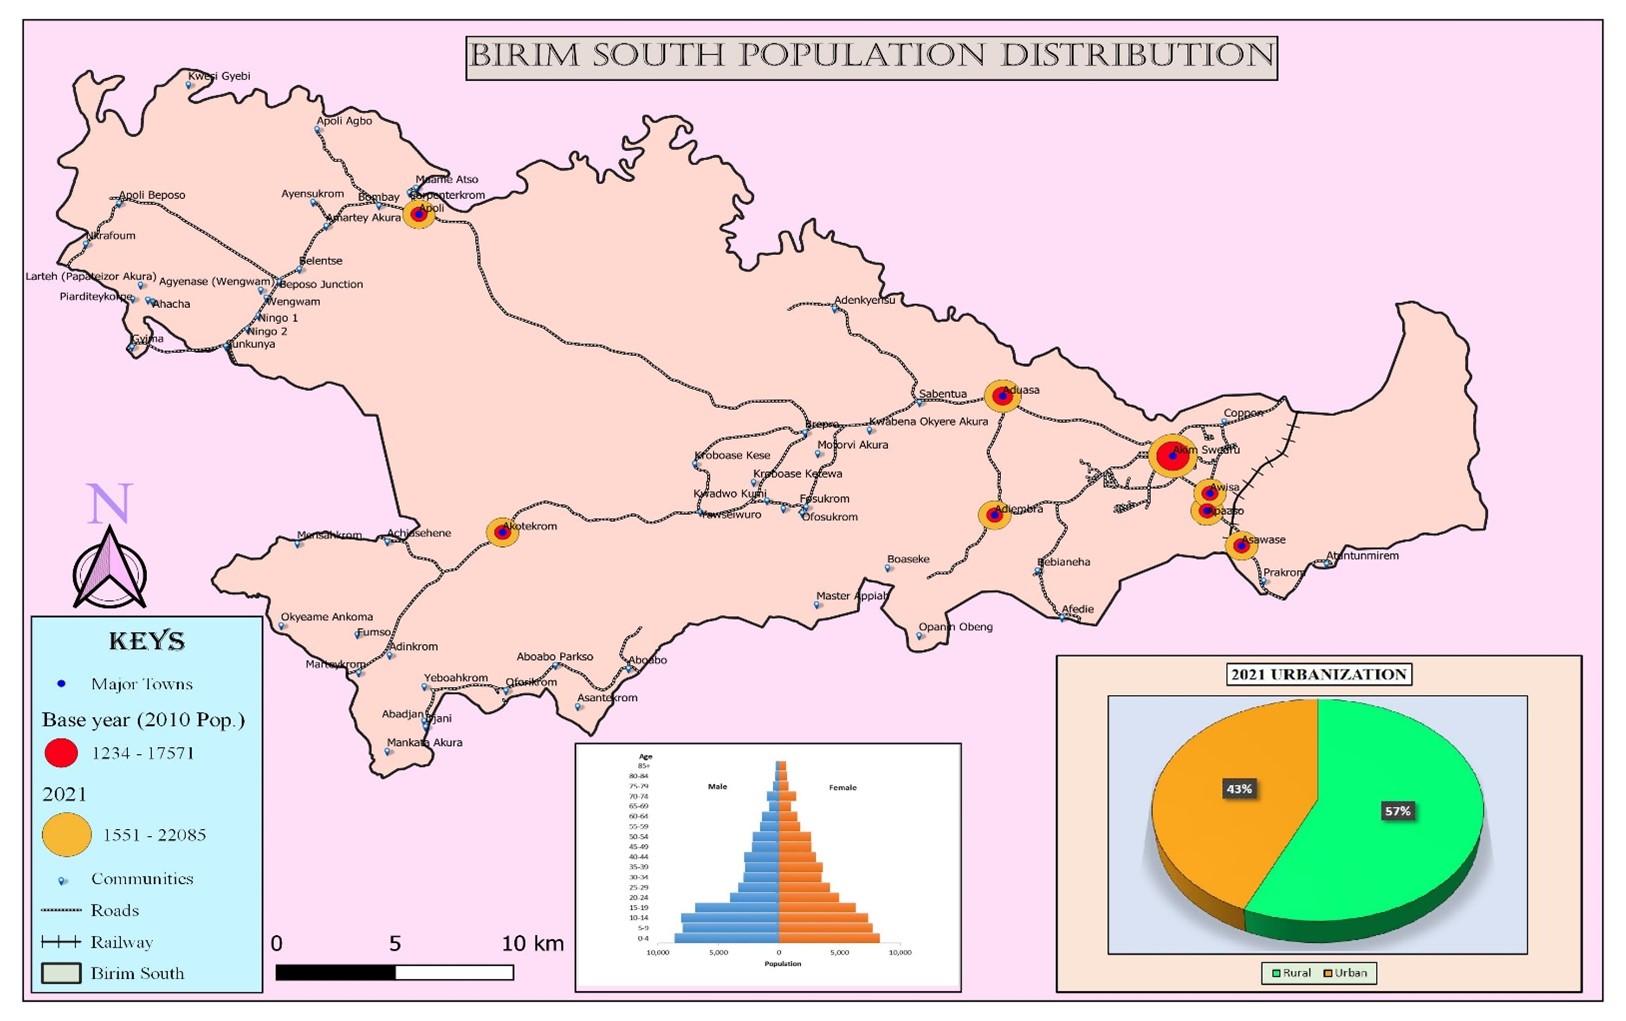
Source: DPCU, 2022
Culture and Ethnicity
The Akan ethnic group is the highest in the district. The majority of Ghanaians in the district are Akans, numbering 28,372 (79.8%). The second most popular ethnic group in the district is Ewe with a population of 2,706 (7.6%) followed by Ga-Adangbe 2,064 (5.8%) then Guan 1,539 (4.3%). Ethnic groups from the northern part of the country and others constitute less than 2.5 per cent of the population. The District is heterogeneous in terms of ethnicity and the greater proportion of the migrant tribes have lived in a peaceful co-existence, a pre-requisite for development.
The District falls under Bosome Traditional Council, Odwira is a festival celebrated by the Bosome traditional council.
There are 3 major sects in the District, the majority of the inhabitants are Christian religion; Islamic and Traditional religions constitute the minority in the District. These structures could be used effectively in the dissemination of information in the District.
Social Services
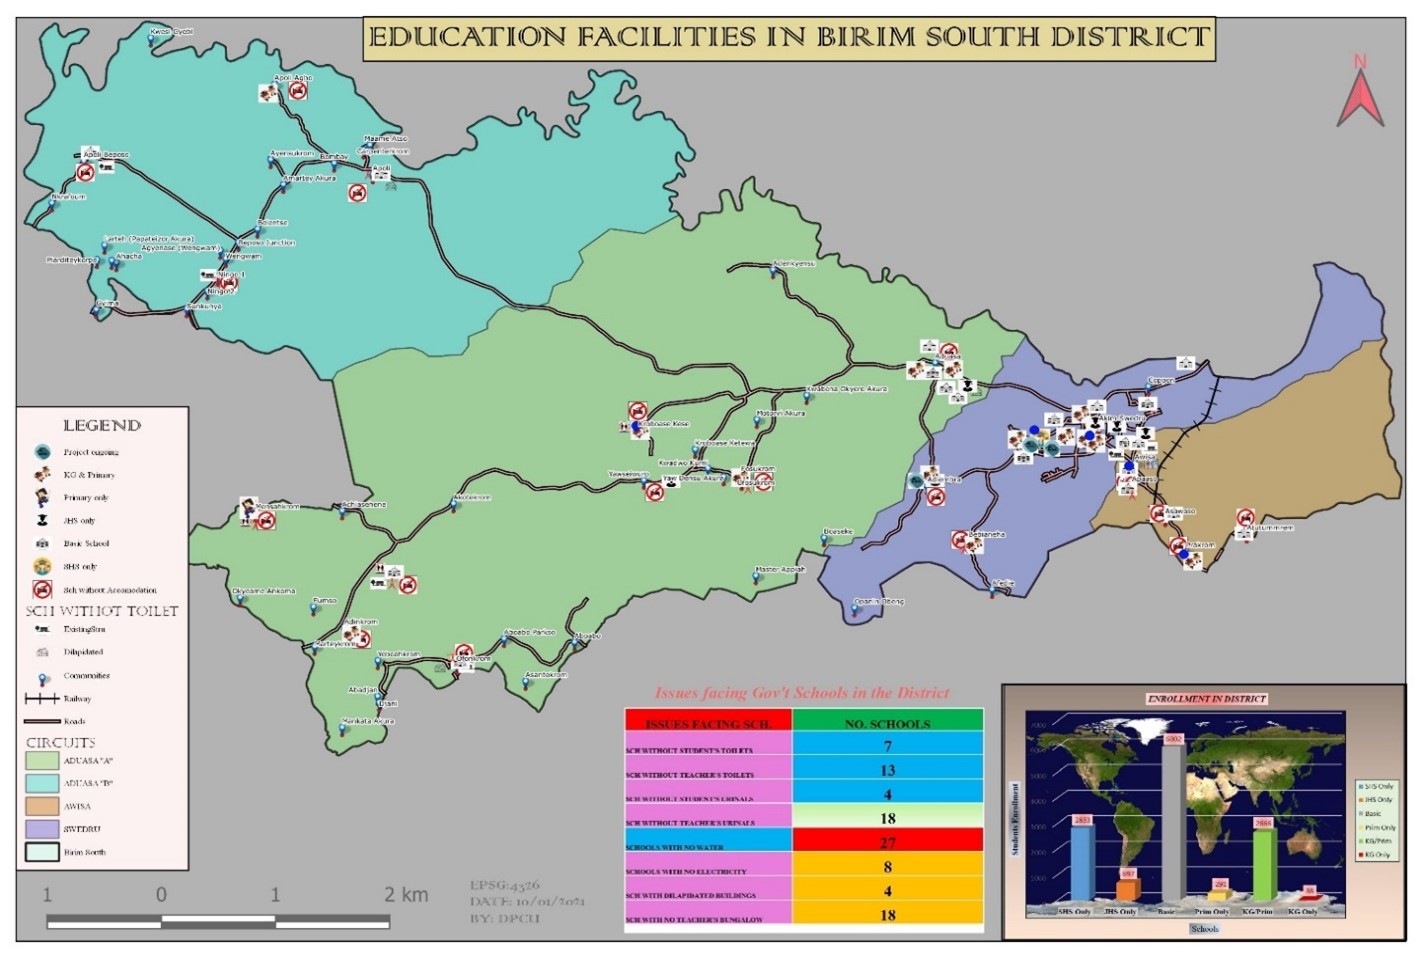
Education Facilities in the District
Table 1.5 shows the ownership and various levels of educational institutions in the district.
There are number 42 educational institutions in the district, out of which 32 (76.2%) are public schools while 10 representing 23.8 per cent are private schools. For all the levels of education, more than 76 per cent are publicly owned, except for Technical and Vocational institutions which are 100 per cent owned and managed by private individuals. The primary level is the highest with 35 facilities, followed by preschool with 32 facilities.
Table 1.3: Numbers of schools in the district
Level |
Public School |
Private School |
Total |
|||
Number |
% |
Number |
% |
Number |
% |
|
Pre- School |
24 |
34.8 |
9 |
36.0 |
33 |
35.1 |
Primary School |
24 |
34.8 |
9 |
36.0 |
33 |
35.1 |
JHS |
20 |
29.0 |
6 |
24.0 |
26 |
27.7 |
SHS |
1 |
1.4 |
– |
– |
1 |
1.1 |
Tec/Voc |
– |
– |
1 |
4.0 |
1 |
1.1 |
Total |
69 |
100 |
25 |
100 |
94 |
100 |
Source: BSD GES EMIS, 2022
School Enrolment
Table 1.6 shows that the total enrolment for the 2021/2022 academic year is 14,102. The level with the highest enrolment is Primary constituting 40.85 per cent and the level with the least enrolment is Technical/Vocation is 0.11 per cent. Enrolment in primary school is twice as much as enrolment in JHS. In general, enrolment decreases with higher education levels. If this trend continues, the quantity of indigenous skilled labour will dwindle.
Out of the total enrolment of 14,102, 10,960 constitute enrolment in public schools and the remaining 3,127 constitute enrolment in private schools. Total male enrolment of 7,155 constitutes 50.74 per cent of total enrolment compared to 49.26 per cent (14,102) of females.
There is a need for all stakeholders to improve and maintain enrolment in JHS and Senior High Schools. Technical/Vocational schools should be developed and made attractive to absorb the pupils who do not have an interest in senior high schools.
Table 1.4: School enrolments in the district
LEVEL |
ENROLMENT (2021/2022 ACADEMIC YEAR) |
|||||||||
PUBLIC |
PRIVATE |
GRAND TOTAL |
% |
|||||||
M |
F |
T |
M |
F |
T |
M |
F |
T |
||
PRESCHOOL |
965 |
863 |
1828 |
802 |
748 |
1550 |
1767 |
1611 |
3378 |
23.95 |
PRIMARY |
2311 |
2150 |
4461 |
609 |
691 |
1300 |
2920 |
2841 |
5761 |
40.85 |
JHS |
1071 |
994 |
2065 |
121 |
156 |
277 |
1192 |
1150 |
2342 |
16.61 |
SHS |
1276 |
1330 |
2606 |
N/A |
N/A |
N/A |
1276 |
1330 |
2606 |
18.48 |
TEC/VOC |
N/A |
N/A |
N/A |
– |
15 |
15 |
– |
15 |
15 |
0.11 |
TOTAL |
5623 |
5337 |
10960 |
1532 |
1595 |
3127 |
7155 |
6947 |
14102 |
100 |
Source: BSD GES EMIS 2022
Staffing of Teachers in the District
Table 1.7, shows the staffing position in the various levels of public schools in the District. The table indicates that there are a total of 353 teaching staff in public schools, out of this number, 167 are females. The table also shows that there are 307 trained teachers and 46 untrained teachers.
Table 1.5: Staffing position in Public schools
Level |
Staff at Post |
Number of Trained Teachers |
Number of Untrained Teachers |
Total |
|
Male |
Female |
||||
KG |
5 |
56 |
48 |
13 |
61 |
Primary |
100 |
79 |
155 |
24 |
179 |
JHS |
81 |
32 |
104 |
9 |
113 |
SHS |
89 |
32 |
N/A |
N/A |
121 |
TOTAL |
186 |
167 |
307 |
46 |
353 |
Source: EMIS GES BSD, 2022
The staffing situation in public schools is quite the opposite of private schools in terms of gender and skills. Table 1.8, shows the staffing position in the various levels of private schools in the District. Out of the total of 72 teachers in private schools, 41 are females. The table also indicates that there are more untrained teachers (56) than trained teachers (16). The implication is that the quality of teaching and learning in private schools will be affected.
Table 1.6: Staffing Position in Private Schools
Level |
Staff at Post |
Number of Trained Teachers |
Number of Untrained Teachers |
Total |
|
Male |
Female |
||||
KG |
1 |
20 |
3 |
18 |
21 |
Primary |
8 |
12 |
4 |
16 |
20 |
JHS |
22 |
9 |
9 |
22 |
31 |
TVET |
– |
2 |
N/A |
N/A |
2 |
Total |
31 |
41 |
16 |
56 |
72 |
Source: EMIS GES BSD, 2021
Source: DPCU, 2022
FINANCIAL PERFORMANCE
The fiscal management of the district comprises revenue mobilization and expenditure administration/transactions. This mainly depends generally on the revenue generated by either local or external sources for the district development. The current decentralization process calls on District Assemblies to be responsible for their financial management. This, however, has challenged the district to generate much of its revenue within the district. The district has three major sources of funds: Internally Generated Funds (IGF), Inter-governmental Fiscal Transfers, and other Financial Arrangements. Major challenges in local IGF collection.
-
Unwillingness on the part of the people to pay rates and fees as a result of a lack of education;
-
Ineffective checks system to ensure proper accounting from revenue collectors;
-
Lack of Logistics such as vehicles for revenue collection activities; and Inaccurate revenue database and unvalued properties
Health
The Birim South District Health Directorate has the primary mandate to ensure that the people living in the district are healthy by providing quality healthcare services to all people living everywhere in the district. This is a priority achieved through continuous access to health services from the community level to the district level. Health delivery in the District is also generally skewed towards the peri-urban centres with few facilities in the rural areas. To increase geographical access to health services more CHPS compounds with accommodation facilities should be provided to rural areas.
Health Facilities
According to Table1.10 presents the distribution of health facilities in the district. Health delivery in the District is carried out by 7 government institutions, and One (1) mission institution. The district has a maternity home and a proposed government hospital, currently ongoing. Community-based Health Planning Services Compounds (CHPS Compound) are 11 representing 73.3 per cent of health facilities while health centres and clinics are three (3) and one (1) respectively.
Table Distribution of Health Facilities by Sub-Districts
Sub-District |
Population |
Type |
|||
CHP |
Health Center |
Clinic |
Total |
||
Aduasa |
4 |
0 |
4 |
||
Apoli |
2 |
1 |
0 |
3 |
|
Swedru |
5 |
2 |
1 |
8 |
|
Total |
36,011 |
11 |
3 |
1 |
15 |
Source: BSD DHA, 2022
Health Personnel
The District Administration has a staff strength of 165 health officers with different skill sets; however, additional 57 health officers are required for efficient health service delivery in the district. Table 1.11 presents the distribution of health professionals in the District. Community health nurses recruited under the Youth Employment Programme represents 43.6 per cent of health personnel in the district. Community health nurses are the second largest number of health workers constituting 30.1 per cent, followed by enrolled nurses (8.5%), midwives (4.2%) and disease control officers. The district does not have a medical doctor; this could be explained by the fact the district does not have a hospital. In addition to these orthodox institutions, the district has trained Traditional Birth Attendances (TBAs) who provide maternal service in various communities. There are also traditional herbal practitioners (THPs) who also contribute to the health needs of the people in one way or the other.
Number of health personnel in the district
Category |
Number |
Percentage |
Medical Doctor |
0 |
0.0 |
Technical Officers (Dip. Disease Control) |
2 |
1.9 |
Field Technicians (Cert. Disease Control) |
2 |
1.9 |
Midwives |
12 |
11.4 |
Community Health Nurses |
50 |
47.6 |
Enrol Nurses (Cert. Nurses in Green) |
22 |
21.0 |
Registered Community Health Nurses (Diploma) |
8 |
7.6 |
Community Health Workers (Youth Employment) |
0 |
0.0 |
Psychiatric Nurses |
4 |
3.8 |
Nutrition Officer |
2 |
1.9 |
Orderlies |
3 |
2.9 |
Administrative Staff (Others) |
10 |
8.7 |
Total |
115 |
100 |
Despite the Assembly’s effort in providing adequate health facilities in the district, the district health administration still battles with the problem of a limited number of health personnel to man these facilities.
Top Ten Diseases
Malaria continues to top the ten (10) diseases and causes of OPD attendance in the District followed by Upper Respiratory Tract Infection, Rheumatism and Diarrhoea over the past two years (2020-2021) as shown in the table below. This situation calls for pragmatic steps to be taken by all stakeholders to control mosquitoes and improve the sanitation situation to reduce the incidence of the disease to the barest minimum. Apart from malaria, non-communicable diseases such as CVA, Hypertension, anaemia, diabetes mellitus and HIV/AIDS are the leading causes of death among adults.
Table 1.10: Top 10 causes of OPD attendance in 2020-2022
NUMBER |
CONDITION |
2020 |
2021 |
2022 |
1 |
Malaria |
13,979 |
17,382 |
6,420 |
2 |
URTI |
7,075 |
9,427 |
4,796 |
3 |
Diarrhoea |
4,306 |
3,825 |
2,343 |
4 |
Rheumatism |
2,526 |
3,255 |
1,961 |
5 |
Skin Diseases |
1,833 |
2,468 |
1,493 |
6 |
Intestinal Worms |
1,810 |
3,062 |
2,167 |
7 |
Anaemia |
1,588 |
3,583 |
2,110 |
8 |
Acute Urinary Tract Infection |
780 |
424 |
222 |
9 |
Typhoid Fever |
186 |
412 |
396 |
10 |
Hypertension |
23 |
291 |
233 |
Source: BSD Health Administration, 2022
Nutrition
The trends of the malnutrition of children between 0-59 months from 2020 and 2021. The current trend for severe malnutrition has comparatively reduced in the past years. For this reason, Health Directorate has intensified efforts to promote growth monitoring and promotion, breastfeeding, food demonstration and school feeding program, to promote and ensure the proper nutritional status of children within the District. Table 1.13 show malnutrition cases recorded in the year 2020 and 2021.
Table 1.11: Nutritional status of the children (0-59) months
STATUS |
2020 |
2021 |
2022 |
Moderate |
146 |
13 |
31 |
Severe |
0 |
3 |
4 |
TOTAL |
146 |
16 |
34 |
Source: BSD Health Administration, 2022
HIV and AIDS
The District AIDS Committee (DAC) and District Response Management Team (DRMT) are the Multi-sectoral and technical response bodies respectively mandated for the management of the HIV response programme in the District. Service provided in the district includes HTC, PMTCT, Condom Distribution, Behavioral Change Communication, and care and support for persons living with HIV.
HIV Testing and Counseling
Available statistics from the District Directorate of Health indicate that 592 (including 460 females) persons were counselled and tested for HIV. Thirty-five (35) females and four (4) males tested positive in 2021.
Table 1.12: Trend of HIV Testing and counselling
Indicators |
SEX |
2020 |
2021 |
2022 |
# Pre-test Counselled |
M |
277 |
132 |
356 |
F |
949 |
460 |
886 |
|
# Tested |
M |
277 |
132 |
356 |
F |
949 |
460 |
886 |
|
# Receiving Positive Test Results |
M |
3 |
4 |
7 |
F |
33 |
35 |
21 |
|
# Receiving Post-test Counselling |
M |
277 |
132 |
356 |
F |
949 |
460 |
886 |
Source: BSD Health Administration, 2022
Prevention of Mother to Child Transmission (PMTCT)
Prevention of Mother to Child Transmission of HIV (PMTCT) is a service provided at antenatal care clinics to all pregnant women to know their HIV status. Every pregnant woman is to be tested for HIV and if positive, given the right treatment to prevent the mother from infecting the baby. The target for this service is pregnant women. All health facilities in the district provide PMTCT services
According to Table 1.15, out of the 521 ANC registrant that was counselled and tested eleven (11) tested positive. Proportionately, the figures for 2021 and 2022 are increasing at an alarming rate.
Table 1.15: Trend of PMTCT performance in Birim South
Indicators |
2018 |
2019 |
2020 |
2021 |
2022 |
# of ANC Registrants |
4,871 |
4,897 |
2,311 |
524 |
535 |
# Tested |
1,275 |
1,033 |
913 |
503 |
521 |
# Receiving Posttest Counseling |
1,275 |
1,033 |
913 |
503 |
535 |
# Positive |
5 |
20 |
5 |
12 |
11 |
Number on Treatment |
5 |
20 |
5 |
12 |
12 |
Source: BSD Health Administration, 2022
Table 1.14: Key Vulnerable and high-risk groups in the District
Vulnerable Groups |
High-Risk Groups |
Apprentices |
Miners |
Students |
Drivers |
Street Children |
Commercial sex workers |
Domestic aid |
Business executives, porters |
Source: BSD Health Administration, 2022
Issues
-
Periodic Shortage and inadequate supply of vaccines, RDT kits for malaria, Syphilis and HIV and AIDS
-
Inadequately trained counsellors for PMTCT services
-
Frequent breakdown of motorbikes and vehicles resulting in high cost and frequency of maintenance
-
Poor data capture at the facility level (e.g. EPI, PMTCT, HTC, malaria, etc.)
-
Lack of vaccine refrigerator in some facilities (10 facilities work without major cold chain equipment)
-
Inadequate vehicles and motorbikes
-
Late reporting of pregnant women to health facilities for ANC services
-
Use of chemoprophylaxis by some chemical sellers in treating malaria patients
-
Inadequate CHPS infrastructure
Poverty, Inequality and Social Protection
Analysis of the social, economic, political and spatial conditions predisposing people into poverty, inequalities and weak social protection should be conducted concerning the extent to which they affect the development of the sector and the MDA. It should take into account adverse policy impacts, weak early warning systems, low priority given to semi-subsistence food farmers and allied occupations, Children in difficult circumstances (child poverty, child abuse, children in conflict with the law, child trafficking, child labour, orphans and vulnerable children), people in disaster-prone areas eg. flooding and fire, PLHIV, persons with disabilities, the analysis should provide the underlying issues to be addressed in the future etc.
Water Security
The availability of potable water is very vital for the socio-economic development of every society. There are about 9 main sources of water for households within the District. Out of this six (6) are potable sources whiles the remaining three (3) are considered not potable sources. The potable sources include: In house tap, in-yard tap, in-yard well (covered), public well (covered), borehole and public taps whereas the non-potable sources include: the yard well (not covered), surface water (river/streams), and public well (not covered). Major sources of water supply in the district include pipe-borne water, boreholes, wells, streams and rivers. Pipe-borne water is concentrated in urban areas such as Akim Swedru the District capital and Akim Awisa. Boreholes, wells, streams or rivers are dominant in rural areas.
Boreholes and wells are also available in the urban areas as supplements due to inadequate and unreliable pipe-borne water supply from the Ghana Water Company. This is attributed to poor capacities of equipment and the fact that some of the facilities are either very old or broken down. The situation is even aggravated by the high rate of expansion in the district capital and other urban centres. There is therefore the need to extend pipe-borne water to growing communities with populations above the threshold of borehole facilities. A typical example is Akim Aduasa which is under Ghana Water Company but hardly enjoys the facility.
In recent times, donor organizations like the Christian Broadcasting Network, Japan Embassy and the Chinese Government have contributed to the improvement of water supply through the provision of mechanized/ manual boreholes and Hand Dug wells with pumps.
Table 1.17 shows the water facility in the district by Area Council. The District has a total of 91 water facilities. In terms of facility type, manual boreholes (52) have the highest concentration, whereas Hand Dug-Out (6) and Wells with pumps (1) have the least concentration the potable water coverage in the district is 62.8 per cent.
Poor management (operation and maintenance) of water facilities especially in rural areas is one of the problems associated with water supply. This has resulted from the low capacity of the Water and Sanitation Teams to run the facilities. In most communities, these teams are non-existent or do not have the full composition.
Table 1.15: Type of Water Facilities in the District
TYPE OF FACILITY |
AKIM SWEDRU |
HDW |
6 |
Manual Boreholes |
52 |
Mechanized Boreholes |
31 |
Wells with pumps |
1 |
Mini Water System |
1 |
Total |
91 |
Source: BSDA DWST, 2022
Figure 1.5: Water Facilities in Birim South District
Source: DPCU, 2022
Sanitation and Waste Management
There are 9 public toilets in the District. These facilities are spread around Akim Swedru and Awisa. Communities like Apoli and Akortekrom do not have any public toilets. The collection, transportation and disposal of solid and liquid waste are the sole responsibility of the District Assembly which operates through the Zoomlion Company limited. Solid waste collection is done in three ways: door to door, dumping at the refuse site and communal container system. Door-to-door services are usually provided to the middle class in communities such as Akim Swedru and Awisa. District Assembly uses 11 refuse containers for communal collection. The District Environmental Health unit in collaboration with Zoomlion regularly administered refuse collection for onward disposal from markets, lorry parks and other public centres.
The District has a landfill site at Aduasa. In an attempt to improve general waste management, the district acquired six (6) acres of land at Aduasa which has been developed by Zoomlion Ghana Limited. Three (3) acres are being used for solid waste management and the rest for liquid waste management.
Table 1.16: Inventory of Public Toilets in Birim South District
No |
Community |
Type |
Number of facilities |
1. |
Akim Swedru sekunde |
20-Seater WC |
1 |
2. |
Akim Swedru Zongo |
20-Seater Vault Chamber toilet |
1 |
3. |
Suame |
10-Seater Septic Tank Latrine |
1 |
4. |
Salem |
20-Seater Septic Tank Latrine |
1 |
5. |
Salem |
12-Seater Septic Aqua privy |
1 |
6. |
Awisa Methodist Area |
10-Seater Septic Tank Latrine (Abandoned) |
1 |
7. |
Awisa Chief Palace |
12-Seater Septic Tank Latrine |
1 |
8. |
Awisa Refuse Dump |
20-Seater Septic Tank Latrine |
1 |
9. |
Awisa Market |
2-Seater WC (Not Functioning) |
1 |
Source: District Environmental Health Unit, 2022
Economic Activities
Agriculture is by far the major economic activity undertaken in the District. According to the 2010 Population and Housing Census, intimately 57.9 per cent of the economically active population is directly involved in agricultural production. The second-largest sector engaging people is wholesale and retail; repair of motorcycles and motor vehicles (12.7%) followed by manufacturing (7.6%). Water supply; sewerage waste management and remediation activities, information and communication, financial and insurance activities and a host of others employ a very low proportion of the population.
The economically active population (persons 15 years and older) is 23,485 (44.1 per cent) of the population while the economically inactive population is 8432 (15.8 per cent). In both instances, there are more females than males. Out of an economically active population of 23,845, the unemployed are 1,174 representing (about 5 per cent).
The employment figures may be misleading as the census report does not indicate whether the income levels of persons employed are enough to pay for their basic needs. The report is also silent on the sustainability of their jobs. The district must advance policies to encourage decent jobs by creating a friendly environment for the private sector. In addition, the Agriculture department in the district is working hard to create about 1,000 jobs at the end of 2025 by involving the youth.
Agriculture
Major activities in the Agricultural sector are crop farming and livestock production employing about 70% of the active working population. Four types of agricultural activities were defined namely crop farming, tree growing, livestock rearing and fish farming. The highest proportion of farming households is engaged in crop farming (98.1%), while the least proportion of households is in fish farming (0.1%). More than 9 in 10 rural households are engaged in crop farming (98.4%) compared to a slightly lower proportion of urban households (97.7%).
Crop Farming
The majority of the farmers in the district are involved in crop farming and the main crops cultivated are:
-
Starchy staples like cassava, cocoyam, and plantain,
-
Legumes like beans; vegetables like tomatoes, okro, garden eggs, pepper, and cabbage.
-
Tree crops like oil palm, cocoa, citrus, and bamboo;
-
Cereals like maize and rice. Maize is planted twice during the year, i.e during the major and minor seasons.
The predominant farm practice is mixed cropping. The crops grow in mixed stands normally inter-cropped with vegetables and cultivated for both home consumption and/or sale.
Types of Livestock and other Animals Reared
Animal rearing is the second most important agricultural activity after crop farming. Most of the farmers engaged in crop farming also keep livestock. The number of animal species kept in the District is 161,770. Out of this number, there are 10,770 keepers and an average of 15 animals per keeper. The average number of animals per keeper for goats and sheep are 9 and 10 respectively. The types of animals reared are sheep, goats, pigs, cattle and poultry. These are reared as supplementary activities to meet part of the protein requirements and to earn additional income. The animals reared are kept in styles pens and hencoops. The goats and sheep are fed through the free grazing method that is grazing on the open vegetation but mostly, pigs are confined especially of the District Assembly by-laws. There are only a few known viable fishponds in the District. The main difficulty lies with the cost of the construction of ponds.
Tree cropping
Tree cropping is also taking prominence in the Birim South District due to the sudden interest in the farming of Oil Palm, Rubber and Cocoa. The mineral commission intervention to supply average annual seedlings of about 55,000 oil palm seedlings to farmers in the district has boosted the interest in oil palm production. Also, cocoa production is a generational tree crop in the district which comes with pride and prestige among indigene. In recent times, rubber plantation is also gradually picking up in the district among some farmers who are willing and converting some lands into rubber production.
The tree crop cropping in the district has contributed to the total tree cover in the district providing the expected climate environment for food production and food security in Birim South District.
Security Situation in the District
The District Assembly has a District Security Council (DISEC) which is made up of all the security institutions in the district namely the Police Service, the Military, the Fire Service and the Immigration Service. The main role of this committee is to ensure that at every point in time there is adequate security in the district to ensure peace and development. The District Security Council met four times in the year 2022. Generally, the district has been relatively calm.
District Police Service
There is one police station in the district. This is located at Akyem Swedru being the District Command. The collaboration between the police officers enhances efficient control of crime in the district. The number of personnel required in the district given the population is 272, however, there are 25 officers currently stationed in the district. The shortage of staff makes mobility to promote law and maintain order in the district very difficult.
The district does not have the Women and Juvenile Unit (WAJU) and therefore collaborate with the WAJU in the Birim Central Municipal on related issues. The district does not have neighbourhood “watchdog” groups. The absence of these departments implies a high degree of vulnerability for women and children as well as general insecurity.
The Police Service faces several challenges and these include:
-
Inadequate office logistics and infrastructure
-
Inadequate personnel and
-
Lack of accommodation for personnel